
SciDraw Alternative: Paper Banana for Scientific Figures
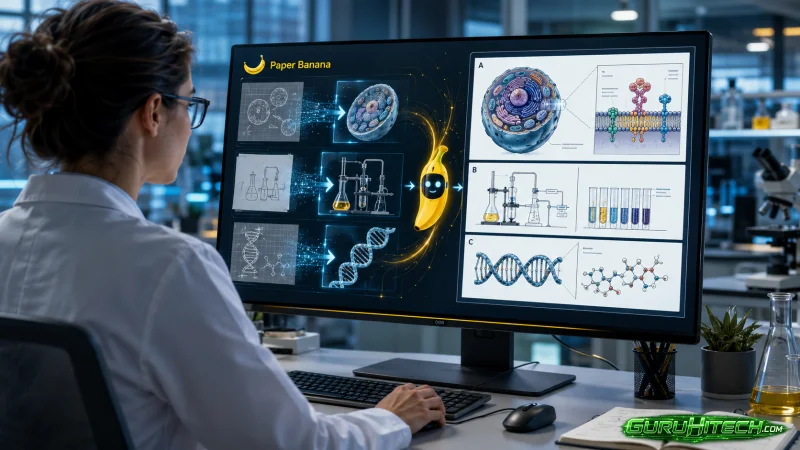
SciDraw AI is a focused scientific-graphics platform. It can turn a text prompt or sketch into an illustration, generate charts from uploaded data, apply journal-oriented visual styles, and export editable formats. For researchers who want one place to create both conceptual illustrations and data charts, that is a useful combination.
But it is not the only workflow worth testing. You may want a SciDraw alternative if your work begins with a methods section or PDF paper, if you need to move from figures to a conference poster, or if you want several image models and editing workflows in one product.
If that describes your project, try the same real research task with paper banana and compare the amount of scientific correction and manual cleanup each result needs.
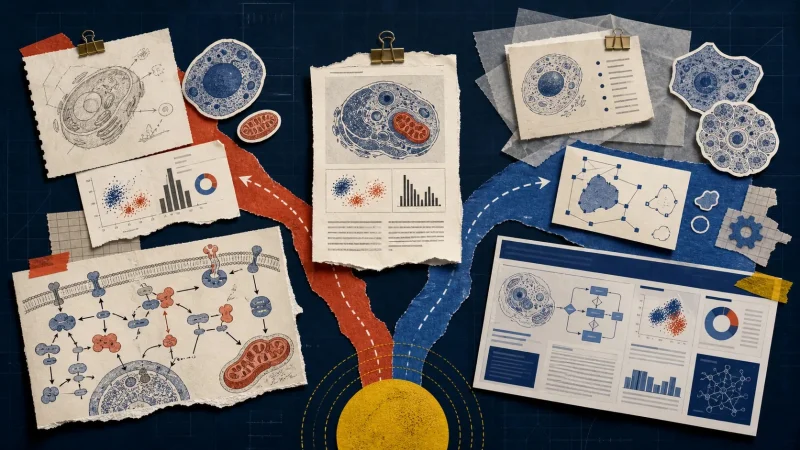
Quick Verdict: SciDraw or Paper Banana?
Choose SciDraw if your priority is prompt- or sketch-based scientific illustration, CSV/Excel chart generation, journal-style presets, and editable SVG or PPTX exports in a single focused product.
Choose Paper Banana if you want to:
- Start from research text, a source image, or a PDF paper
- Generate figures across biology, medicine, computer science, engineering, and interdisciplinary research
- Choose from multiple image models for different cost and quality needs
- Create editable SVG figures and refine selected areas
- Continue from a paper into a conference-poster workflow
Neither product can verify your science for you. Check every label, arrow, molecular structure, unit, scale, legend, statistical mark, and causal claim before publication.
What Matters When Choosing a SciDraw Alternative
The most impressive first image is not always the most useful research figure. A better comparison asks what happens after the first draft: Can you correct a label without rebuilding the composition? Does the diagram preserve the meaning of the methods section? Can collaborators edit the output in the tools they already use?
In practice, three qualities matter most: scientific accuracy, editability, and visual consistency. Those criteria are more useful than judging a product from a single polished example.
| What to test | Why it matters |
| Scientific accuracy | A plausible-looking pathway, structure, or arrow can still be wrong |
| Semantic fidelity | The figure should preserve the meaning of your methods, not merely the visual style |
| Editability | Reviewer changes are faster when labels, arrows, panels, and layers remain adjustable |
| Data integrity | Quantitative charts must match the source data and remain reproducible |
| End-to-end workflow | Export cleanup, poster work, and collaboration time affect the real cost of a figure |
This leads to a practical rule for any AI scientific-figure tool: use generation to create the visual structure, then use domain expertise and an editable format to verify and refine it.
How SciDraw Approaches Scientific Illustration
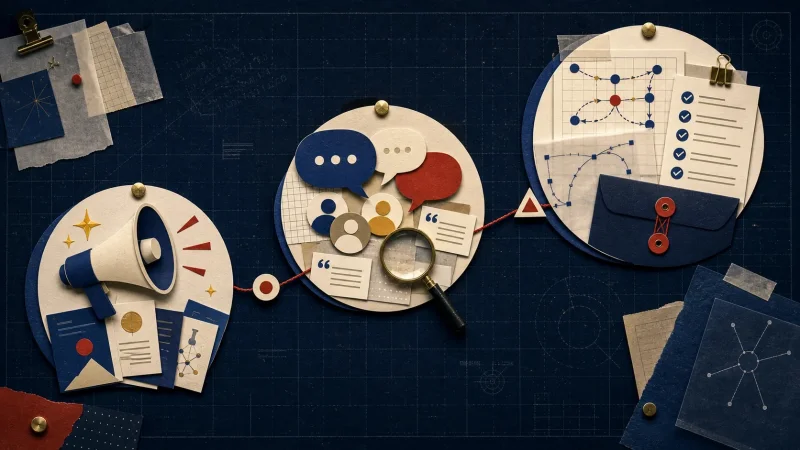
SciDraw presents three main AI modes and several research-specific workflows.
AI scientific illustration
The product supports text-to-image generation and sketch or image editing. Its examples cover graphical abstracts, biological mechanisms, chemistry, engineering, manuscript-to-figure workflows, teaching diagrams, and posters.
Smart data charts
SciDraw supports CSV and Excel upload, automatic chart suggestions, more than ten chart types, colorblind-friendly palettes, and exports including PNG, PDF, EPS, and TIFF. This is a meaningful differentiator if your daily work combines conceptual figures with conventional data visualization.
For quantitative results, however, always compare the generated chart against the source table. A code-based workflow in Matplotlib, Plotly, ggplot2, or your lab’s validated statistics pipeline remains the safer option when exact values and reproducibility matter.
Editable and journal-oriented output
SciDraw highlights editable SVG and PPTX exports as well as visual presets associated with journals such as Nature, Science, Cell, PLOS, and ACS.
Treat a journal preset as a starting style, not proof of compliance. Final dimensions, font sizes, color rules, accessibility, file format, and resolution still need to match the current author instructions for your target journal.
SciDraw vs Paper Banana: Feature Comparison
| Decision area | SciDraw | Paper Banana |
| Best starting point | Prompt, sketch, source image, CSV, or Excel data | Methods text, manuscript content, prompt, source image, or PDF paper |
| Core workflow | Generate scientific illustrations or charts, then export editable assets | Generate from research material, refine figures or SVGs, edit selected areas, and continue into a poster workflow |
| Research visuals | Scientific illustrations, graphical abstracts, charts, posters, and teaching diagrams | Scientific illustrations, diagrams, editable SVG figures, plots, image edits, paper figures, and conference posters |
| Data charts | Dedicated smart-chart workflow with multiple chart types | Plot and figure workflows are available, but SciDraw presents a more explicit CSV/Excel chart product |
| Model choice | SciDraw emphasizes its workflow rather than a broad user-facing model menu | Multiple image models let users balance style, resolution, cost, and generation behavior |
| Vector editing | Editable SVG and PPTX export | Editable SVG generation plus a scientific figure editor for labels, panels, annotations, assets, and layers |
| Poster workflow | SciDraw lists poster creation among its use cases | Dedicated Poster Maker starts from a PDF paper and supports selectable image models |
| Journal styling | Named journal-style presets are a prominent feature | Publication-oriented visual workflows, with final journal compliance left to the researcher |
| Free access | Its pricing page lists 10 signup credits plus 5 daily credits | Free credits are available for trying generation; current allowance can change |
| Entry paid plan | Standard is listed at $20 monthly, or $10/month when billed annually, with 300 credits | Basic starts at $19/month with 500 monthly credits |
| Strongest fit | Researchers who want illustration and smart-chart generation in a focused tool | Researchers who want a broader path from research text or paper to editable figures, image edits, and posters |
Prices and allowances can change. Verify the live pricing page before purchasing either product.
Where SciDraw Is Stronger
1. CSV and Excel chart generation is a first-class workflow
SciDraw does not position charts as an afterthought. Data upload, chart suggestions, chart types, palettes, and publication export formats are part of the main experience.
2. Journal-style presets are easy to understand
Named visual presets give researchers a familiar starting point. They do not replace journal checks, but they can shorten the styling conversation at the beginning of a project.
3. PPTX export can fit collaborative lab workflows
Many teams still review figures and posters in PowerPoint. An editable PPTX path may be convenient when collaborators are not comfortable editing SVGs directly.
4. Its free allowance is clear
The pricing page lists signup credits and a daily allowance, making it easy to run an initial test before selecting a paid plan.
Where Paper Banana Is the Better SciDraw Alternative
1. The workflow starts with your research material
Paper Banana accepts the material researchers already have: a methods paragraph, model description, abstract, source image, existing visual, or PDF paper. The objective is not only to make a polished image, but to turn the structure of the research into a usable visual draft.
2. You can choose among multiple image models
Different models behave differently with scientific detail, typography, composition, reference images, and local editing. Paper Banana exposes model choice so you can match the model and resolution to the task instead of using one generation path for every figure.
3. Figure editing and selected-area revision stay connected
Reviewer feedback rarely asks for a completely new image. It asks for one corrected label, an extra arrow, a cleaner panel, or a revised region. Paper Banana combines editable SVG workflows with a figure editor and selected-area image editing, reducing unnecessary regeneration.
4. A paper can continue into a conference poster
Paper Banana includes a dedicated Poster Maker that can start from a PDF paper. This matters when the same research story needs to become a manuscript figure, presentation visual, and conference poster without rebuilding the entire hierarchy from scratch.
5. The workflow covers more research-communication formats
Scientific illustration, diagrams, SVG figures, plots, image edits, paper visuals, and posters are available in the same product. That breadth is useful for interdisciplinary teams and for researchers whose deliverables change across a project.
Test the workflow with Paper Banana.
A Safer AI Scientific-Figure Workflow
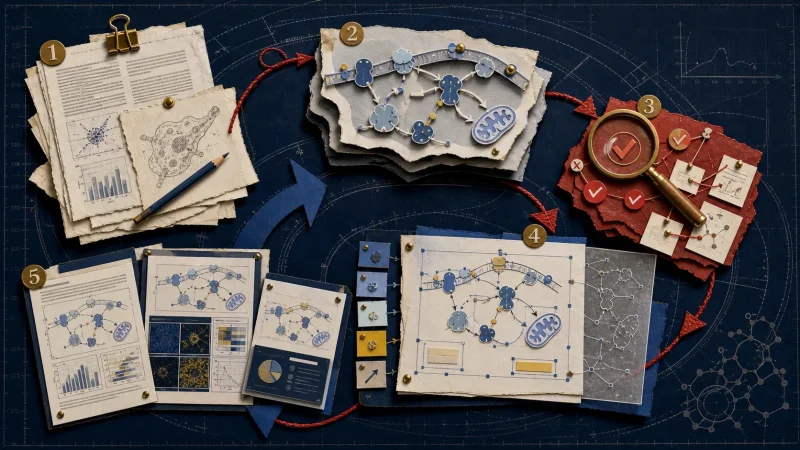
Whether you choose SciDraw or Paper Banana, use a human-in-the-loop process.
Step 1: Define the scientific claim
Write down what the figure must communicate and what it must not imply. Include required entities, directionality, units, controls, and uncertainty.
Step 2: Generate a structural first draft
Judge hierarchy, panel order, and visual flow before polishing small details. If the structure is wrong, more decorative detail will not rescue it.
Step 3: Run a scientific verification pass
Check labels, pathways, organelles, molecular structures, axes, legends, scales, statistical notation, and causal arrows against your source material.
Step 4: Correct the editable version
Use SVG, PPTX, or a dedicated editor to make precise corrections. Avoid repeatedly regenerating the full figure when only one region needs work.
Step 5: Validate the final deliverable
Inspect the exported figure inside the actual manuscript, slide, or poster. Confirm readability at final size and follow the target publisher’s current requirements.
Who Should Choose SciDraw?
SciDraw is likely the better fit if:
- You want prompt- and sketch-driven scientific illustration in a focused interface
- CSV or Excel chart generation is central to your workflow
- Named journal-style presets help your team establish a visual direction
- Editable SVG and PPTX exports match the tools your collaborators already use
- You have tested a representative figure and are satisfied with the correction workload
Who Should Choose Paper Banana?
Paper Banana is likely the better fit if:
- Your starting point is usually a methods section, manuscript, source image, or PDF paper
- You want multiple image models rather than a single generation path
- You need editable SVG diagrams and selected-area revisions
- You create scientific illustrations, AI or engineering diagrams, paper figures, and conference posters
- You want to keep figure creation and poster generation in one research workflow
Who Should Not Switch Yet?
Stay with SciDraw if it already produces accurate drafts for your field, its chart workflow saves time, and your team actively uses its editable exports or journal presets.
Do not switch simply because another tool has a longer feature list. First compare one difficult real project and record generation attempts, scientific corrections, editor time, export cleanup, and total cost.
You should also avoid uploading confidential, unpublished, patient-identifiable, export-controlled, or commercially sensitive material to any AI service until you have reviewed its current privacy policy, retention practices, terms, and your institution’s rules.
SciDraw and Paper Banana Pricing
At the time of writing, SciDraw’s pricing page listed:
- Free signup: 10 credits plus 5 daily credits
- Standard: $20 monthly, or an advertised $10/month on annual billing, with 300 credits and approximately 60 images
- Premium: $40 monthly, or $20/month on annual billing, with 800 credits
- Enterprise: $80 monthly, or $40/month on annual billing, with 2,000 credits
Paper Banana’s Basic plan starts at $19/month and includes 500 monthly credits, watermark-free downloads, priority generation, multiple image models, SVG scientific illustration, editable diagram generation, and poster creation. One-time credit packages are also available.
Credit totals alone are not a fair cost comparison because models and resolutions may consume different amounts. Calculate the cost of one accepted figure after corrections, not merely the cost of one generation.
A Note on the Paper Banana Name
Several unrelated products and an open-source research framework use similar versions of the Paper Banana name. The original PaperBanana paper and research repository are associated with work by authors from Peking University and Google research.
paperbanana.me, the product discussed in this comparison, is a separate commercial service. It is not presented as an official deployment of that research repository. If you encounter another Paper Banana site, check the domain before assuming it belongs to the same product.
FAQ
What is the best SciDraw alternative?
Paper Banana is a strong SciDraw alternative for researchers who want to begin with research text or a PDF paper, choose among multiple image models, generate editable SVG figures, revise selected areas, and continue into a conference poster. SciDraw remains compelling for smart data charts, journal-style presets, and SVG or PPTX export.
Is SciDraw free?
SciDraw’s pricing page listed 10 signup credits and 5 daily credits at the time of writing. Paid plans add more credits and export or usage rights. Confirm the live plan before relying on those allowances.
Can SciDraw generate publication-ready figures?
It can generate polished scientific illustrations and editable outputs, but “publication-ready” still requires a researcher to verify the science and check the current requirements of the target journal.
Can Paper Banana create editable scientific figures?
Yes. Paper Banana includes editable SVG scientific figure and diagram workflows, along with tools for changing labels, panels, annotations, assets, and selected image regions.
Which tool is better for data charts?
SciDraw presents the clearer dedicated CSV/Excel-to-chart workflow. For quantitative publications, verify all values and consider a reproducible code-based plot regardless of which AI tool helps with styling.
Which tool is better for conference posters?
Paper Banana has a dedicated Poster Maker designed to begin with a PDF paper and generate the poster in the background. SciDraw also lists posters among its use cases, but its product focus is broader across illustrations and charts.
Can I upload unpublished research?
Only after checking the service’s current terms, privacy policy, retention rules, and your institution’s requirements. Remove confidential and identifying information whenever possible.
Test the Alternative with One Real Figure
Feature lists cannot tell you which tool will understand your research more accurately. Choose one difficult figure, use the same source material, and compare structure, scientific corrections, editability, export cleanup, time, and total credit cost.
Start that practical comparison with paper banana.
Ti potrebbe interessare:
Segui guruhitech su:
- Google News: bit.ly/gurugooglenews
- Telegram: t.me/guruhitech
- Facebook: facebook.com/guruhitechfb
- Instagram: instagram.com/guruhitech_official/
- X (Twitter): x.com/guruhitech1
- Bluesky: bsky.app/profile/guruhitech.bsky.social
- Rumble: rumble.com/user/guruhitech
- VKontakte: vk.com/guruhitech
- MeWe: mewe.com/i/guruhitech
- Skype: live:.cid.d4cf3836b772da8a
- WhatsApp: bit.ly/whatsappguruhitech
Esprimi il tuo parere!
Ti è stato utile questo articolo? Lascia un commento nell’apposita sezione che trovi più in basso e se ti va, iscriviti alla newsletter.
Per qualsiasi domanda, informazione o assistenza nel mondo della tecnologia, puoi inviare una email all’indirizzo [email protected].
Scopri di più da GuruHiTech
Abbonati per ricevere gli ultimi articoli inviati alla tua e-mail.